

Install Grafana
Create namespace
kubectl create ns monitoringAdd repo
helm repo add bitnami https://charts.bitnami.com/bitnamiUpdate repo
helm repo updateView version
helm search repo -l bitnami/grafana | headCreate custom_values.yaml
I added an annotation because I wanted an internal IP for the Load Balancer. Feel free to remove that section.
vi custom_values.yaml
service:
  type: LoadBalancer
  annotations:
    cloud.google.com/load-balancer-type: "Internal"
# Set to Recreate if you use persistent volume that cannot be mounted by more than one pods to make sure the pods is destroyed first.
updateStrategy:
  type: Recreate
persistence:
  enabled: true
  accessModes: ReadWriteOnce
  size: 200Gi
Install
helm install grafana \
  -n monitoring \
  -f custom_values.yaml \
  --version 6.1.5 \
  bitnami/grafana
Connect
- un: admin
# Password
echo "Password: $(kubectl get secret grafana-admin --namespace monitoring \
-o jsonpath="{.data.GF_SECURITY_ADMIN_PASSWORD}" | base64 --decode)"
Port forward.
kubectl port-forward svc/grafana 8081:3000 -n monitoring
open http://localhost:8081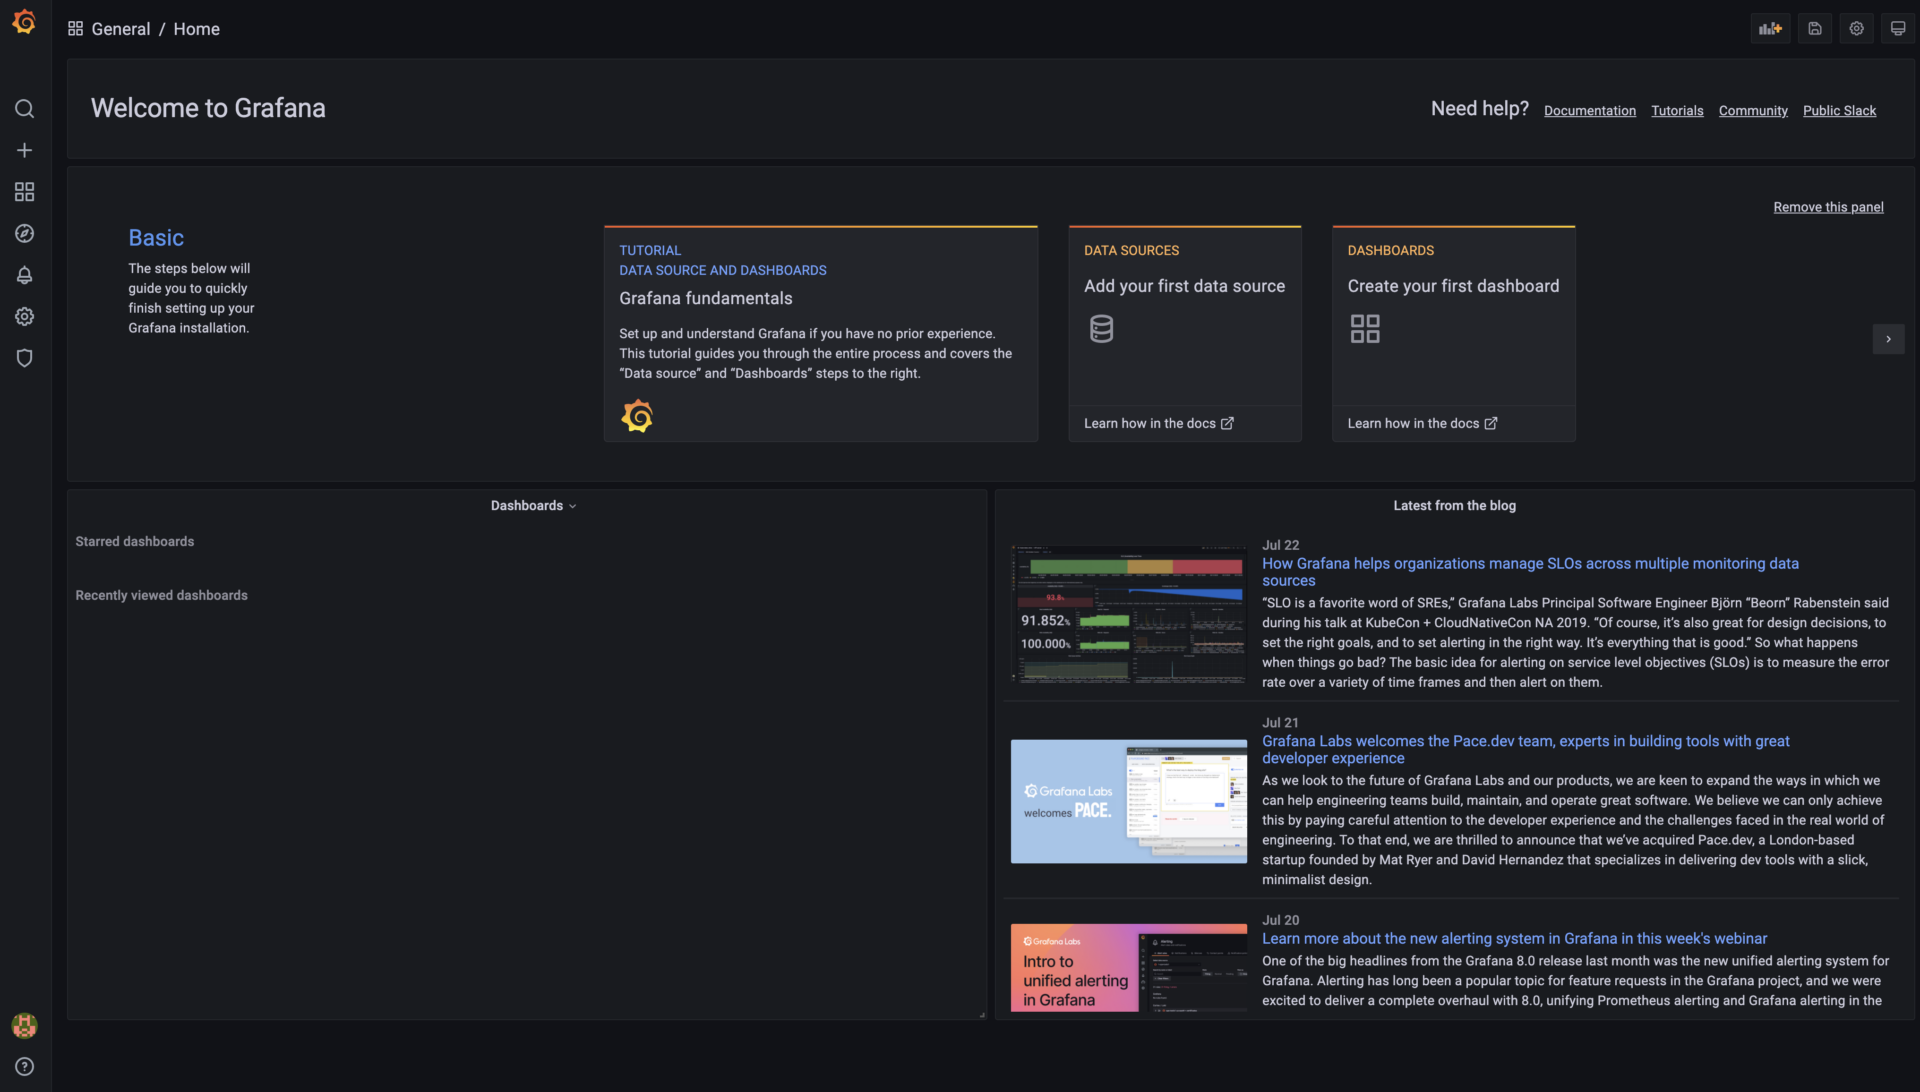
Install Prometheus
View versions
helm search repo -l bitnami/kube-prometheus | headCreate custom_values.yaml
vi custom_values.yaml
prometheus:
  enabled: true
  persistence:
    accessModes:
      - ReadWriteOnce
    size: 200Gi

alertmanager:
  persistence:
    enabled: true
    accessModes:
      - ReadWriteOnce
    size: 200Gi

# Depending on which DNS solution you have installed in your cluster, enable the right option
# kubectl get po -n kube-system| grep dns
coreDns:
  enabled: false

kubeProxy:
  enabled: true
Install
helm install prometheus \
  -n monitoring \
  -f custom_values.yaml \
  --version 6.1.4 \
  bitnami/kube-prometheus
Connect
# Prometheus
kubectl port-forward --namespace monitoring svc/prometheus-kube-prometheus-prometheus 9090:9090
open http://localhost:9090

# Alert Manager
kubectl port-forward --namespace monitoring svc/prometheus-kube-prometheus-alertmanager 9093:9093
open http://localhost:9093

# Kube-State-Metrics
kubectl port-forward svc/prometheus-kube-state-metrics -n monitoring 4000:8080
open http://localhost:4000
Configure
Add Prometheus to Grafana.
Configuration → Data sources → Add data sourse → Prometheus (Select)
Add the following URL to the HTTP / URL section.
Note: Make sure to add the correct namespace within theprometheus service URL (in my case, I installed prometheus within the monitoring namespace).
http://prometheus-kube-prometheus-prometheus.monitoring.svc.cluster.local:9090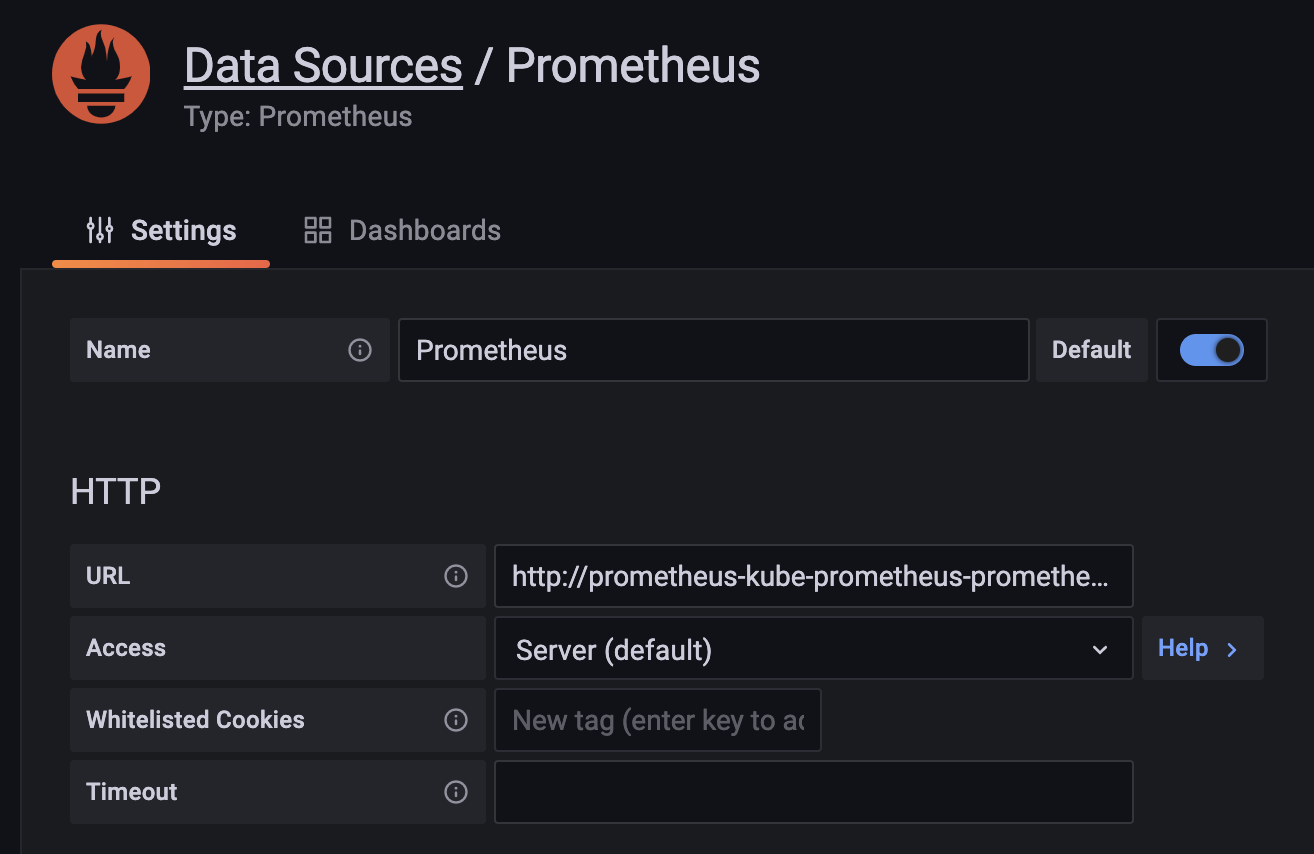
Click Save & test.
Clean up
helm uninstall grafana -n monitoring
helm uninstall prometheus -n monitoring